Home prices across Metro Vancouver’s housing market showed modest increases in March, while new listings remained below long-term historical averages.
March data also indicates home sales are making a stronger than expected spring showing so far, despite elevated borrowing costs.
The Real Estate Board of Greater Vancouver (REBGV) reports that residential home sales in the region totalled 2,5352 in March 2023, a 42.5 per cent decrease from the 4,405 sales recorded in March 2022, and 28.4 per cent below the 10-year seasonal average (3,540).
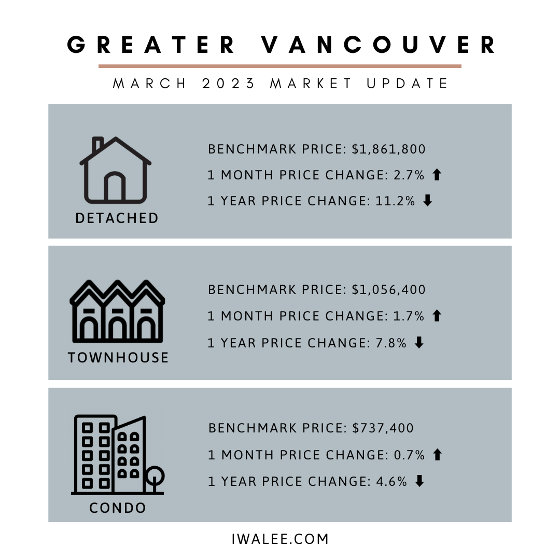
The MLS® Home Price Index composite benchmark price for all residential properties in Metro Vancouver is currently $1,143,900. This represents a 9.5 per cent decrease over March 2022 and a 1.8 per cent increase compared to February 2023.
“On the pricing side, the spring market is already on track to outpace our 2023 forecast, which anticipated modest price increases of about one to two per cent across all product types,” Andrew Lis, REBGV’s director of economics and data analytics said. “The surprising part of this recent activity is that these price increases are occurring against a backdrop of elevated borrowing costs, below-average sales, and new listing activity that continues to suggest that sellers are awaiting more favorable market conditions.”
There were 4,317 detached, attached and apartment properties newly listed for sale on the Multiple Listing Service® (MLS®) in Metro Vancouver in March 2023. This represents a 35.5 per cent decrease compared to the 6,690 homes listed in March 2022, and was 22.3 per cent below the 10-year seasonal average (5,553).
The total number of homes currently listed for sale on the MLS® system in Metro Vancouver is 8,617, an 8.1 per cent increase compared to March 2022 (7,970), and 17.3 per cent below the 10- year seasonal average (10,421).
Across all detached, attached and apartment property types, the sales-to-active listings ratio for March 2023 is 30.7 per cent. By property type, the ratio is 23.3 per cent for detached homes, 36.7 per cent for townhomes, and 34.9 per cent for apartments.
Analysis of historical data suggests downward pressure on home prices occurs when the ratio dips below 12 per cent for a sustained period, while home prices often experience upward pressure when it surpasses 20 per cent over several months.
“If home sellers remain on the sidelines, monthly MLS® sales figures will continue to appear lower than historical averages as we move toward summer,” Lis said. “But it’s important to recognize the chicken-and-egg nature of these statistics. The number of sales in any given month is partially determined by the number of homes that come to market that month, along with the inventory of unsold homes listed in previous months. With fewer homes coming on the market,homes sales will remain lower than we’re accustomed to seeing at this point in the year, almost entirely by definition.”
Momentum continues to build in the Fraser Valley real estate market
SURREY, BC – March 2023 saw the second consecutive month of growth in sales in the Fraser Valley, and although still below seasonal norms, the trend is an encouraging sign that the region continues to head towards increased market stability.
At 1,550, property sales posted on the FVREB’s Multiple Listings Service (MLS®) were 72.6 per cent higher than sales recorded last month. Although 39.9 per cent lower than a year ago and nearly 25 per cent below the ten-year average, it marks the first time since August that monthly sales exceeded the 1,000 level.
“After months of uncertainty made it difficult for buyers and sellers to re-enter the housing market, we may well be seeing a turning point,” said Narinder Bains, Chair of the Fraser Valley Real Estate Board. “The pause in rate hikes has helped to restore a much-needed sense of predictability, which is building consumer confidence. As a result, we’re starting to see more traffic at open houses along with more multiple offer situations.”
As in all regions across the province and the country, low supply is still an issue and a primary factor driving price growth.
New listings, at 2,559, were 32 per cent higher than in February, but still 44.1 per cent below last year, while active listings were up by 2.8 per cent over last month and 3.5 per cent below last year. However, both are well off the ten-year average and among the lowest March listings recorded in a decade.
As a result, the aggregate sales-to-active listings ratio grew to 34 per cent, shifting the market into sellers territory, with demand for townhomes even more pronounced, at a 62 per cent ratio. (The market is considered balanced when the sales-to active listings ratio is between 12 per cent and 20 per cent.)
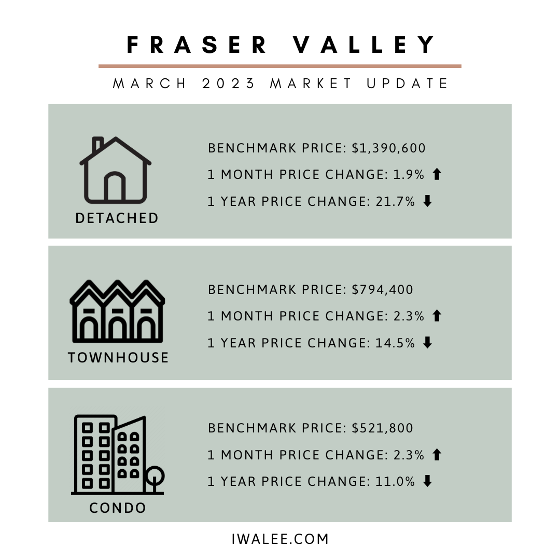
Benchmark prices continued to edge upward with roughly two per cent month-over-month growth across all categories. The composite Benchmark price was $965,100 in March.
“While market demand continues to trend up, we still face an uphill battle on the supply side, which is keeping prices elevated,” said FVREB CEO, Baldev Gill. “The province will require sustained inventory growth of at least 25 per cent over each of the next five years in order to normalize inventories. Until then, we strongly advise buyers and sellers to consult with a REALTOR® to plan the best strategy.”
Properties spent slightly fewer days on the market compared to last month with detached homes posting 30 days on the market and apartments 29. Townhomes moved faster, at 26 days.
Get in touch with Iwa if you want to know specifically about any areas, property types, or trends that you can take advantage of in 2023.