
As summer winds to a close, higher borrowing costs have begun to permeate the Metro Vancouver housing market in predictable ways, with price gains cooling and sales slowing along the typical seasonal pattern.
The Real Estate Board of Greater Vancouver (REBGV) reports that residential home sales in the region totalled 2,296 in August 2023, a 21.4 per cent increase from the 1,892 sales recorded in August 2022. This was 13.8 per cent below the 10-year seasonal average (2,663).
“It’s been an interesting spring and summer market, to say the least” Andrew Lis, REBGV’s director of economics and data analytics said. “Borrowing costs are fluctuating around the highest levels we’ve seen in over ten years, yet Metro Vancouver’s housing market bucked many pundits’ predictions of a major slowdown, instead posting relatively strong sales numbers and year-to-date price gains north of eight per cent, regardless of home type.”
There were 3,943 detached, attached and apartment properties newly listed for sale on the Multiple Listing Service® (MLS®) in Metro Vancouver in August 2023. This represents an 18.1 per cent increase compared to the 3,340 homes listed in August 2022. This was 5.3 per cent below the 10-year seasonal average (4,164).
The total number of homes currently listed for sale on the MLS® system in Metro Vancouver is 10,082, a 0.2 per cent decrease compared to August 2022 (10,099). This was 13.4 per cent below the 10-year seasonal average (11,647).
Across all detached, attached and apartment property types, the sales-to-active listings ratio for August 2023 is 23.9 per cent. By property type, the ratio is 14.2 per cent for detached homes, 30.3 per cent for townhomes, and 31.9 per cent for apartments.
Analysis of the historical data suggests downward pressure on home prices occurs when the ratio dips below 12 per cent for a sustained period, while home prices often experience upward pressure when it surpasses 20 per cent over several months.
“It’s a bit of a tortoise and hare story this year, with sales starting the year slowly while prices increased due to low inventory levels,” Lis said. “As fall approaches, sales have caught up with the price gains, but both metrics are now slowing to a pace that is more in-line with historical seasonal patterns, and with what one might expect given that borrowing costs are where they are.”
The MLS® Home Price Index composite benchmark price for all residential properties in Metro Vancouver is currently $1,208,400. This represents a 2.5 per cent increase over August 2022 and a 0.2 per cent decrease compared to July 2023.
Sales of detached homes in August 2023 reached 591, a 13.2 per cent increase from the 522 detached sales recorded in August 2022. The benchmark price for a detached home is $2,018,500. This represents a 3.3 per cent increase from August 2022 and a 0.3 per cent increase compared to July 2023.
Sales of apartment homes reached 1,270 in August 2023, a 27.4 per cent increase compared to the 997 sales in August 2022. The benchmark price of an apartment home is $770,000. This represents a 4.4 per cent increase from August 2022 and a 0.2 per cent decrease compared to July 2023.
Attached home sales in August 2023 totalled 422, an 18.9 per cent increase compared to the 355 sales in August 2022. The benchmark price of an attached home is $1,103,900. This represents a 3.9 per cent increase from August 2022 and a 0.1 per cent decrease compared to July 2023.
Fraser Valley real estate sales dip in August; prices hold steady
A combination of seasonal trends and cautious anticipation of the next rate announcement saw the Fraser Valley real estate market slow in August as sales fell slightly for the second month, after reaching a 15-month high in June.
The Fraser Valley Real Estate Board recorded 1,273 sales on its Multiple Listing Service (MLS®) in August 2023, a decrease of 6.9 per cent compared to July. Sales were up 25.2 per cent compared to August 2022.
New listings dropped to 2,622 in August, a decrease of 8.2 per cent over last month, but 28.2 per cent above this time last year. Active listings have been rising since last December and grew again in August by 1.5 per cent to 6,291, just 7 per cent off the ten-year average.
“Many buyers are in “watchful waiting” mode as they hold off on decisions in anticipation of potential further rate changes,” said Narinder Bains, Chair of the Fraser Valley Real Estate Board. “With prices relatively stable and active inventory on the rise, we hope to see more new listings come on stream over the next couple of months, especially if rates hold steady.”
With a sales-to-active-listings ratio of 16 per cent, the market for detached homes was balanced between supply and demand. Demand for townhomes and apartments remained stronger (38 per cent and 32 per cent, respectively). The market is considered balanced when the sales-to-active-listings ratio is between 12 per cent and 20 per cent.
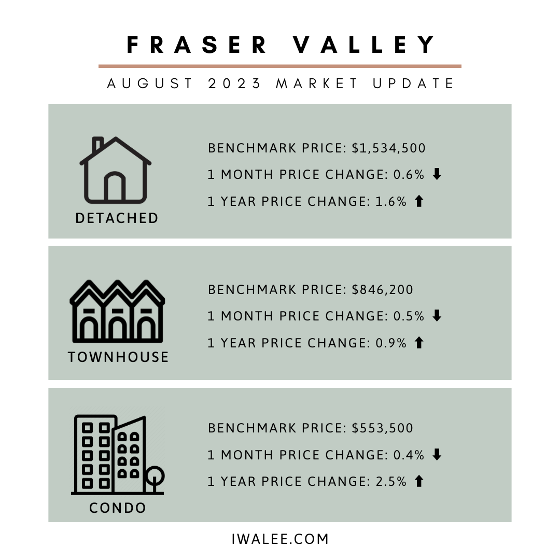
Benchmark prices in the Fraser Valley, remained relatively unchanged compared to last month with gains of less than one per cent across all property types. See below for more information.
“We expect to see market activity pick up heading into the fall months,” said FVREB CEO, Baldev Gill. “That said, with the uncertainty surrounding interest rates as well as the potential impact of provincial housing strategy initiatives, buyers and sellers would be well-advised to consult with a professional REALTOR® to assess any risks and opportunities before making a decision.”
On average properties spent between two and four weeks on the market before selling, with townhomes and apartments moving faster (16 and 20 days, respectively) than detached homes (25 days).
Get in touch with Iwa if you want to know specifically about any areas, property types, or trends that you can take advantage of in 2023.