RSS

The number of transactions on the Multiple Listing Service® (MLS®) declined in May compared to what is typical for this time of year in Metro Vancouver. This shift has allowed the inventory of homes available for sale to continue to accumulate with over 13,000 homes now actively listed on the MLS® in the region. 

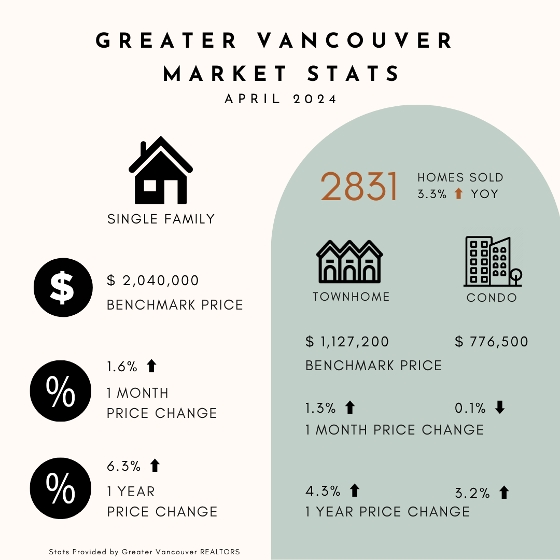
The Greater Vancouver REALTORS® (GVR) reports that residential sales in the region totalled 2,733 in May 2024, a 19.9 per cent decrease from the 3,411 sales recorded in May 2023. Last month’s sales total was also down 19.6 per cent from the 10-year seasonal average for May (3,398). 

“The surprise in the May data is that sales have come in softer than what we’d typically expect to see at this point in the year, while the number of newly listed homes for sale is carrying some of the momentum seen in the April data,” Andrew Lis, GVR’s director of economics and data analytics said. “It’s a natural inclination to chalk these trends up to one factor or another, but what we’re seeing is a culmination of factors influencing buyer and seller decisions in the market right now. It’s everything from higher borrowing costs, to worries about the economy, to policy interventions imposed by various levels of government.” 

There were 6,374 detached, attached and apartment properties newly listed for sale on the MLS® in Metro Vancouver in May 2024. This represents a 12.6 per cent increase compared to the 5,661 properties listed in May 2023 and a seven per cent increase compared to the 10-year seasonal average (5,958). 

The total number of properties currently listed for sale on the MLS® system in Metro Vancouver is 13,600, a 46.3 per cent increase compared to May 2023 (9,293). This total is also up 19.9 per cent above the 10-year seasonal average (11,344). 

Across all detached, attached and apartment property types, the sales-to-active listings ratio for May 2024 is 20.8 per cent. By property type, the ratio is 16.8 per cent for detached homes, 25.1 per cent for attached, and 22.5 per cent for apartment properties.

Analysis of the historical data suggests downward pressure on home prices occurs when the ratio dips below 12 per cent for a sustained period, while home prices often experience upward pressure when it surpasses 20 per cent over several months. 

“With market trends now tilting back toward more balanced conditions, as the number of new listings outpaces the number of sales, we should expect to see slower price growth over the coming months,” Lis said. “Up until recently, prices were climbing modestly across all market segments. But with rising inventory levels and softening demand, buyers who’ve been waiting for an opportunity might have more luck this summer, even if borrowing costs remain elevated.” 


Spring inventory continues to build in the Fraser Valley to levels not seen in nearly five years

Slower seasonal sales helped build inventory to its highest level since September 2019 in the Fraser Valley in May, creating more balanced market conditions for home buyers and sellers. The increase in supply over the past several months has further contributed to a softening of price growth, which is good news for buyers.

Active listings increased eight per cent from April to May to 7,904 — up 42 per cent over May 2023 and 19 per cent above the 10-year average.

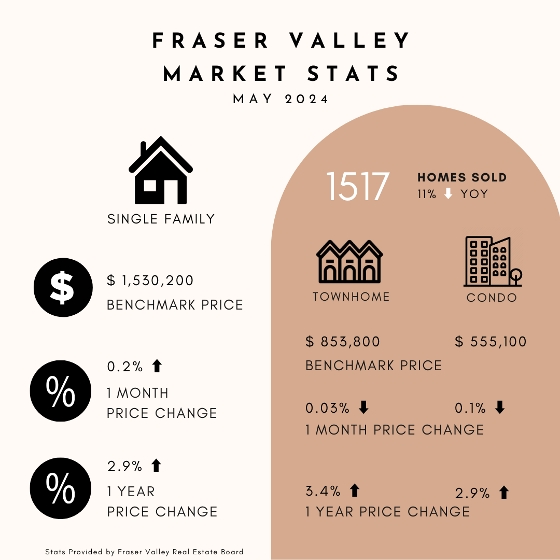
Sales, however, remained seasonally slow, with 1,517 transactions on the Fraser Valley Real Estate Board’s Multiple Listings Service ® (MLS®) in May, up 3 per cent from April, but down 11 per cent compared to May 2023. May sales were 21 per cent below the 10-year average.

“We are seeing an influx of inventory this spring, primarily due to slower than usual spring sales,” said Jeff Chadha, Chair of the Fraser Valley Real Estate Board. “Growing inventory levels are helping to create a healthy balance in the market, giving buyers more options, especially as prices continue to flatten.”

New listings softened in May, down five per cent from April, to 3,760. With a sales-to-active listings ratio of 19 per cent, overall market conditions are balanced. The market is considered balanced when the ratio is between 12 per cent and 20 per cent.

“While the consensus seems to indicate rate cuts in the latter half of the year, there is considerably less agreement about either magnitude or timing,” said FVREB CEO Baldev Gill. “We strongly encourage buyers to have comprehensive discussions with their REALTORS® about market conditions and how they will impact mortgage rates in the coming year.”

The average number of days townhomes and single-family detached homes are spending on the market increased slightly in May. Detached homes are spending 25 days on the market, up from 23 in April. Townhomes are spending 20 days on the market, up one day from April, and condos remain steady at 23 days on the market.

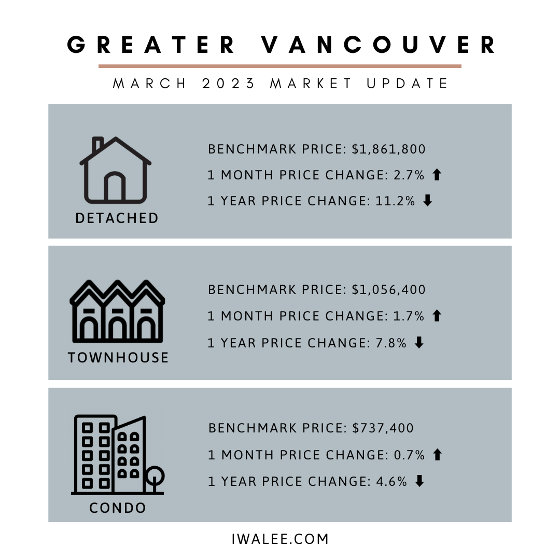
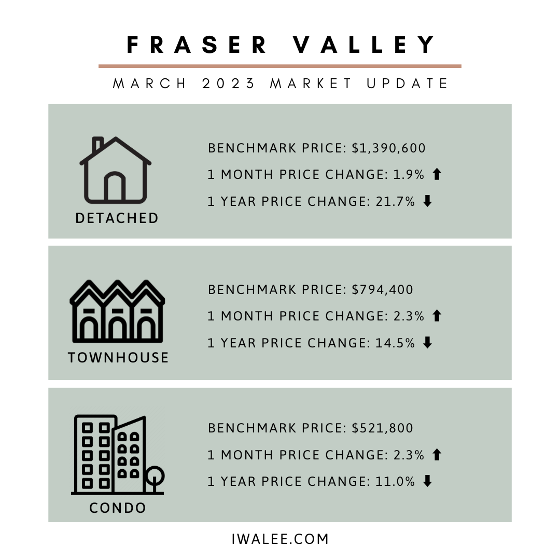
Benchmark prices in the Fraser Valley remained flat in May, with the composite Benchmark price down 0.2 percent from April and down 0.8 per cent from May 2023.

If you are interested in learning about the specific stats of a neighborhood, reach out to Iwa. They can provide insights on areas, property types, or trends you can leverage in 2024.

Read


Actively listed homes for sale on the MLS® in Metro Vancouver1 continued climbing in April, up 42 per cent year-over-year, breaching the 12,000 mark, a number not seen in the region since the summer of 2020.

Greater Vancouver REALTORS® (GVR)2 reports that residential sales3 in the region totalled 2,831 in April 2024, a 3.3 per cent increase from the 2,741 sales recorded in April 2023. This was 12.2 per cent below the 10-year seasonal average (3,223).

"It’s a feat to see inventory finally climb above 12,000. Many were predicting higher inventory levels would materialize quickly when the Bank of Canada began its aggressive rate hikes, but we’re only seeing a steady climb in inventory in the more recent data. The surprise for many market watchers has been the continued strength of demand along with the fact few homeowners have been forced to sell in the face of the highest borrowing costs experienced in over a decade." Andrew Lis, REBGV director of economics and data analytics

There were 7,092 detached, attached and apartment properties newly listed for sale on the Multiple Listing Service® (MLS®) in Metro Vancouver in April 2024. This represents a 64.7 per cent increase compared to the 4,307 properties listed in April 2023. 

This was 25.8 per cent above the 10-year seasonal average (5,637).

The total number of properties currently listed for sale on the MLS® system in Metro Vancouver is 12,491, a 42.1 per cent increase compared to April 2023 (8,790). 

This is 16.7 per cent above the 10-year seasonal average (10,704).

Across all detached, attached and apartment property types, the sales-to-active listings ratio for April 2024 is 23.5 per cent. By property type, the ratio is 17.6 per cent for detached homes, 31.0 per cent for attached, and 26.0 per cent for apartments.

Analysis of the historical data suggests downward pressure on home prices occurs when the ratio dips below 12 per cent for a sustained period, while home prices often experience upward pressure when it surpasses 20 per cent over several months.

“Another surprising story in the April data is the fact prices continue climbing across most segments with recent increases typically in the range of one to two per cent month-over-month,” Lis said.

“The one segment that didn’t see an uptick in prices in April were apartments, which saw a 0.1 per cent decline month-over-month. This moderation is likely due to a confluence of factors impacting this more affordability sensitive segment of the market, particularly the impact of higher mortgage rates and the recent boost to inventory levels, tempering competition somewhat.”

The MLS® Home Price Index composite benchmark price for all residential properties in Metro Vancouver is currently $1,205,800. This represents a 2.8 per cent increase over April 2023 and a 0.8 per cent increase compared to March 2024.

Sales of detached homes in April 2024 reached 814, a 0.7 per cent increase from the 808 detached sales recorded in April 2023. The benchmark price for a detached home is $2,040,000. This represents a 6.3 per cent increase from April 2023 and a 1.6 per cent increase compared to March 2024.

Sales of apartment homes reached 1,416 in April 2024, a 0.2 per cent increase compared to the 1,413 sales in April 2023. The benchmark price of an apartment home is $776,500. This represents a 3.2 per cent increase from April 2023 and a 0.1 per cent decrease compared to March 2024.

Attached home sales in April 2024 totalled 580, a 16 per cent increase compared to the 500 sales in April 2023. The benchmark price of a townhouse is $1,127,200. This represents a 4.3 per cent increase from April 2023 and a 1.3 per cent increase compared to March 2024.

Get in touch with Iwa if you want to know specifically about any areas, property types, or trends that you can take advantage of in 2024.

Read

While Metro Vancouver home sellers appeared somewhat hesitant in January, new listings rose 31 per cent year-over-year in February, bringing a significant number of newly listed properties to the market.

Greater Vancouver REALTORS® (GVR)2 reports that residential sales3 in the region totalled 2,070 in February 2024, a 13.5 per cent increase from the 1,824 sales recorded in February 2023. This was 23.3 per cent below the 10-year seasonal average (2,699).

"While the pace of home sales started the year off briskly, the pace of newly listed properties in January was slower by comparison. A continuation of this pattern in February would have been concerning, as it could quickly tilt the market towards overheated conditions." Andrew Lis, REBGV director of economics and data analytics

“With new listings up about 31 per cent year-over-year in February, this will relieve some of the pressure that was building in January and offer buyers more choice as we enter the spring and summer markets.”

There were 4,560 detached, attached and apartment properties newly listed for sale on the Multiple Listing Service® (MLS®) in Metro Vancouver in February 2024. This represents a 31.1 per cent increase compared to the 3,478 properties listed in February 2023. This was 0.2 per cent below the 10-year seasonal average (4,568).

The total number of properties currently listed for sale on the MLS® system in Metro Vancouver is 9,634, a 16.3 per cent increase compared to February 2023 (8,283). This is three per cent above the 10-year seasonal average (9,352).

Across all detached, attached and apartment property types, the sales-to-active listings ratio for February 2024 is 22.4 per cent. By property type, the ratio is 16 per cent for detached homes, 27.9 per cent for attached, and 25.9 per cent for apartments.

Analysis of the historical data suggests downward pressure on home prices occurs when the ratio dips below 12 per cent for a sustained period, while home prices often experience upward pressure when it surpasses 20 per cent over several months.

“Even with the increase in new listings however, standing inventory levels were not high enough relative to the pace of sales to mitigate price acceleration in February, with most segments of the market moving into sellers’ territory,” Lis said.

“This competitive dynamic has led to modest price growth across all market segments this month, but it’s noteworthy that benchmark prices remain below the peak observed in the spring of 2022, before the market internalized the full effect of the Bank of Canada’s tightening cycle.”

The MLS® Home Price Index composite benchmark price for all residential properties in Metro Vancouver is currently $1,183,300. This represents a 4.5 per cent increase over February 2023 and a 1.9 per cent increase compared to January 2024.

Sales of detached homes in February 2024 reached 560, an 8.3 per cent increase from the 517 detached sales recorded in February 2023. The benchmark price for a detached home is $1,972,400. This represents a 7.2 per cent increase from February 2023 and a 1.5 per cent increase compared to January 2024.

Sales of apartment homes reached 1,092 in February 2024, a 17.7 per cent increase compared to the 928 sales in February 2023. The benchmark price of an apartment home is $770,700. This represents a 5.6 per cent increase from February 2023 and a 2.5 per cent increase compared to January 2024.

Attached home sales in February 2024 totalled 403, a 10.1 per cent increase compared to the 366 sales in February 2023. The benchmark price of a townhouse3 is $1,094,700. This represents a 4.2 per cent increase from February 2023 and a 2.6 per cent increase compared to January 2024.

Get in touch with Iwa if you want to know specifically about any areas, property types, or trends that you can take advantage of in 2024.


Read

The month-over-month price gains seen earlier this year abated in the Metro Vancouver housing market in September due to a seasonal decline in sales and a modest increase in inventory levels across the region. 


The Real Estate Board of Greater Vancouver (REBGV) reports that residential home sales in the region totalled 1,926 in September 2023, a 13.2 per cent increase from the 1,701 sales recorded in September 2022. This was 26.3 per cent below the 10-year seasonal average (2,614). 


“A key dynamic that we’ve been watching this year has been the reluctance of some homeowners to list their homes given that mortgage rates are the highest they’ve been in over ten years,” Andrew Lis, REBGV’s director of economics and data analytics said. “With fewer listings coming to the market earlier this year than usual, inventory levels remained very low, which led prices to increase throughout the spring and summer months.” 


There were 5,446 detached, attached and apartment properties newly listed for sale on the Multiple Listing Service® (MLS®) in Metro Vancouver in September 2023. This represents a 28.4 per cent increase compared to the 4,243 homes listed in September 2022.  


This was 5.2 per cent above the 10-year seasonal average (5,179). 


The total number of homes currently listed for sale on the MLS® system in Metro Vancouver is 11,382, a 9.2 per cent increase compared to September 2022 (10,427). This was 6.2 per cent below the 10-year seasonal average (12,136). 


Across all detached, attached and apartment property types, the sales-to-active listings ratio for September 2023 is 17.7 per cent. By property type, the ratio is 12.6 per cent for detached homes, 21.6 per cent for townhomes, and 21.3 per cent for apartments. 


Analysis of the historical data suggests downward pressure on home prices occurs when the ratio dips below 12 per cent for a sustained period, while home prices often experience upward pressure when it surpasses 20 per cent over several months. 


“In contrast to the spring and summer, the September data suggests there may be a renewed interest on the part of sellers to participate in the market, with new listing activity rising back in line with long-term historical averages. This upward shift in new listings has allowed overall inventory levels to recover modestly from the low levels we saw earlier this year,” Lis said. “When we pair this dynamic with the slowdown in sales that typically occurs in the fall as a result of seasonal patterns, the outcome is more balanced market conditions overall.” 


The MLS® Home Price Index composite benchmark price for all residential properties in Metro Vancouver is currently $1,203,300. This represents a 4.4 per cent increase over September 2022 and a 0.4 per cent decrease compared to August 2023. 


Sales of detached homes in September 2023 reached 572, a 7.5 per cent increase from the 532 detached sales recorded in September 2022. The benchmark price for a detached home is $2,017,100. This represents a 5.8 per cent increase from September 2022 and a 0.1 per cent decrease compared to August 2023. 


Sales of apartment homes reached 988 in September 2023, an 11.3 per cent increase compared to the 888 sales in September 2022. The benchmark price of an apartment home is $768,500. This represents a 5.8 per cent increase from September 2022 and a 0.2 per cent decrease compared to August 2023. 


Attached home sales in September 2023 totalled 352, a 28.5 per cent increase compared to the 274 sales in September 2022. The benchmark price of an attached home is $1,098,400. This represents a 5.3 per cent increase from September 2022 and a 0.5 per cent decrease compared to August 2023. 

Fraser Valley market balanced, as demand softens and prices edge lower

Continued slowing sales and a healthy rise in new listings in September has brought the Fraser Valley housing market into balance. Three months of declining sales has seen Benchmark prices dip for a second straight month.

The Fraser Valley Real Estate Board recorded 1,100 sales on its Multiple Listing Service® (MLS®) in September 2023, a decrease of 13.6 per cent compared to August. Sales were up 22.6 per cent compared to September 2022.

New listings rose to 2,860 in September, an increase of 9.1 per cent over last month, and 25.8 per cent above this time last year. Active listings have been rising since last December and grew again in September by 3.8 per cent to 6,532, 3.5 per cent below the ten-year average.

“With inventory levels continuing on a slow and steady rise, together with slow sales, what we are seeing is a more balanced market,” said Narinder Bains, Chair of the Fraser Valley Real Estate Board. “If this trend continues, increased new listings will help to maintain a balanced market, giving buyers greater choice.”

The market for detached homes softened again in September, with a sales-to-active listings ratio of 14 per cent, down from 16 per cent in August. Demand for townhomes and apartments remained stronger (31 per cent and 25 per cent, respectively). The overall sales-to-active listing ratio is at 17 per cent, representing a balanced market. The market is considered balanced when the sales-to-active-listings ratio is between 12 per cent and 20 per cent.

Benchmark prices in the Fraser Valley dipped compared to last month with losses of less than one per cent across all property types.

“With interest rate uncertainty still in play, September sales were slower than the trends for this time of year,” said FVREB CEO, Baldev Gill. “Market activity and prices can vary from neighbourhood to neighbourhood, so consulting your REALTOR® will be a vital step for buyers and sellers who need expert guidance and advice to navigate local market conditions.”

On average properties spent a minimum of three weeks on the market before selling, with townhomes and apartments moving faster (23 and 24 days, respectively) than detached homes (29 days).


Get in touch with Iwa if you want to know specifically about any areas, property types, or trends that you can take advantage of in 2023.

Read

Continuing the trend that has emerged in the housing market this year, the benchmark price for all home types in Metro Vancouver1 increased in June as home buyer demand butted up against a limited inventory of homes for sale in the region.


The Real Estate Board of Greater Vancouver (REBGV) reports that residential home sales2 in the region totalled 2,988 in June 2023, a 21.1 per cent increase from the 2,467 sales recorded in June 2022. This was 8.6 per cent below the 10-year seasonal average (3,269).


“The market continues to outperform expectations across all segments, but the apartment segment showed the most relative strength in June,” Andrew Lis, REBGV’s director of economics and data analytics said. “The benchmark price of apartment homes is almost cresting the peak reached in 2022, while sales of apartments are now above the region’s ten-year seasonal average. This uniquely positions the apartment segment relative to the attached and detached segments where sales remained below the ten-year seasonal averages.”


There were 5,348 detached, attached and apartment properties newly listed for sale on the Multiple Listing Service® (MLS®) in Metro Vancouver in June 2023. This represents a 1.3 per cent increase compared to the 5,278 homes listed in June 2022. This was 3.1 per cent below the 10-year seasonal average (5,518).


The total number of homes currently listed for sale on the MLS® system in Metro Vancouver is 9,990, a 7.9 per cent decrease compared to June 2022 (10,842) This was 17.4 per cent below the 10-year seasonal average (12,091).


Across all detached, attached and apartment property types, the sales-to-active listings ratio for June 2023 is 31.4 per cent. By property type, the ratio is 20.9 per cent for detached homes, 38.5 per cent for townhomes, and 39.4 per cent for apartments.


Analysis of the historical data suggests downward pressure on home prices occurs when the ratio dips below 12 per cent for a sustained period, while home prices often experience upward pressure when it surpasses 20 per cent over several months.


“Despite elevated borrowing costs, there continues to be too little resale inventory available relative to the pool of buyers in Metro Vancouver. This is the fundamental reason we continue to see prices increase month over month across all segments,” Lis said. “With the benchmark price for apartments now standing at $767,000, we repeat our call to the provincial government to adjust the $525,000 threshold exempting first-time home buyers from the Property Transfer Tax to better reflect the price of entry-level homes in our region. This is a simple policy adjustment that could help more first-time buyers afford a home right now.” 


The MLS® Home Price Index composite benchmark price for all residential properties in Metro Vancouver is currently $1,203,000. This represents a 2.4 per cent decrease over June 2022 and a 1.3 per cent increase compared to May 2023.


Sales of detached homes in June 2023 reached 848, a 28.3 per cent increase from the 661 detached sales recorded in June 2022. The benchmark price for a detached home is $1,991,300. This represents a 3.2 per cent decrease from June 2022 and a 1.9 per cent increase compared to May 2023.


Sales of apartment homes reached 1,573 in June 2023, an 18.6 per cent increase compared to the 1,326 sales in June 2022. The benchmark price of an apartment home is $767,000. This represents a 0.5 per cent increase from June 2022 and a 0.8 per cent increase compared to May 2023.


Attached home sales in June 2023 totalled 547, a 17.6 per cent increase compared to the 465 sales in June 2022. The benchmark price of an attached home is $1,098,900. This represents a one per cent decrease from June 2022 and a 1.5 per cent increase compared to May 2023.

Low supply continues to impact home pricing in the Fraser Valley: Sales increasing despite rate hikes

SURREY, BC – The Fraser Valley real estate market saw strong sales activity in June with levels on par with the 10-year average for the month, amid on-going challenges with supply.

In June, the Fraser Valley Real Estate Board (FVREB) processed 1,935 sales on its Multiple Listing Service® (MLS®), an increase of 51.1 per cent compared to June 2022 and a 13.1 per cent increase compared to May.

“As seen in recent months, prices continue to trend upward, with lack of supply and high demand for housing,“ said Narinder Bains, Chair of the Fraser Valley Real Estate Board. “What we’re seeing is sales increasing, with buyers entering the market despite current financial implications of anticipated rate hikes.”

The Board received 3,424 new listings in June, an increase of 2.8 per cent compared to last year, and a decrease of 3.1 per cent compared to May 2023. The month ended with a total active inventory of 5,944, a 6.9 per cent increase compared to May, and 8.2 per cent less than June of last year.

A number of factors are at play in the Fraser Valley market, from low supply to unprecedented interest rates – the highest in more than 20 years,” said Board CEO, Baldev Gill. “For those seeking to enter the market, whether buying or selling, only a professional REALTOR® can provide the expert guidance and advice to fully evaluate each clients’ needs, and to protect their interests.”

Across Fraser Valley in June, the average number of days to sell a single-family detached home was 21 and a townhome was 16 days. Apartments took, on average, 22 days to sell.


Get in touch with Iwa if you want to know specifically about any areas, property types, or trends that you can take advantage of in 2023.

Read

With listing activity remaining below historical norms, home sales in Metro Vancouver have mounted a surprising comeback, rising near levels seen last spring, before eight consecutive interest rate hikes eroded borrowing power and brought home sales activity down along with it.


The Real Estate Board of Greater Vancouver (REBGV) reports that residential home sales in the region totalled 2,741 in April 2023, a 16.5 per cent decrease from the 3,281 sales recorded in April 2022, and 15.6 per cent below the 10-year seasonal average (3,249). 


“The fact we are seeing prices rising and sales rebounding this spring tells us home buyers are returning with confidence after a challenging year for our market, with mortgage rates roughly doubling,” Lis said. “The latest MLS HPI® data show home prices have increased about five per cent year-to-date, which already outpaces our forecast of one to two per cent by year-end. The year is far from over, however, and it remains to be seen if these price increases will be sustained into 2024.” 


There were 4,307 detached, attached and apartment properties newly listed for sale on the Multiple Listing Service® (MLS®) in Metro Vancouver in April 2023. This represents a 29.7 per cent decrease compared to the 6,128 homes listed in April 2022, and was 22 per cent below the 10-year seasonal average (5,525). 


The total number of homes currently listed for sale on the MLS® system in Metro Vancouver is 8,790, a 4.2 per cent decrease compared to April 2022 (9,176), and 20.9 per cent below the 10-year seasonal average (11,117). 


Across all detached, attached and apartment property types, the sales-to-active listings ratio for April 2023 is 32.7 per cent. By property type, the ratio is 24.4 per cent for detached homes, 40.1 per cent for townhomes, and 37.4 per cent for apartments. 


Analysis of the historical data suggests downward pressure on home prices occurs when the ratio dips below 12 per cent for a sustained period, while home prices often experience upward pressure when it surpasses 20 per cent over several months. 


“When we released our market forecast in January, we were one of the only organizations taking the contrarian view that prices were likely to appreciate in 2023,” Lis said. “And what we’re seeing unfold so far this year is consistent with our prediction that near record-low inventory levels would create competitive conditions where almost any resurgence in demand would translate to price escalation, despite the elevated borrowing cost environment. At the crux of it, the issue remains a matter of far too little resale supply available relative to the pool of active buyers in our market.” 


The MLS® Home Price Index composite benchmark price for all residential properties in Metro Vancouver is currently $1,170,700. This represents a 7.4 per cent decrease over April 2022 and a 2.4 per cent increase compared to March 2023. 


Sales of detached homes in April 2023 reached 808, a 16.3 per cent decrease from the 965 detached sales recorded in April 2022. The benchmark price for detached properties is $1,915,800. This represents an 8.8 per cent decrease from April 2022 and a 2.9 per cent increase compared to March 2023. 


Sales of apartment homes reached 1,413 in April 2023, a 16.5 per cent decrease compared to the 1,693 sales in April 2022. The benchmark price of an apartment property is $752,300. This represents a 3.1 per cent decrease from April 2022 and a two per cent increase compared to March 2023. 


Attached home sales in April 2023 totalled 500, a 13.5 per cent decrease compared to the 578 sales in April 2022. The benchmark price of an attached unit is $1,078,400. This represents a 6.1 per cent decrease from April 2022 and a 2.1 per cent increase compared to March 2023.  


Spring sales hold steady in Fraser Valley real estate market.

Despite persistent inventory shortfalls, housing sales in the Fraser Valley remained steady in April as buyers took advantage of the continued pause in interest rate hikes.

In April, the Fraser Valley Real Estate Board (FVREB) processed 1,554 sales on its Multiple Listing Service® (MLS®), virtually unchanged compared to March and a slight decrease of 5.1 per cent compared to April 2022.

“Buyers are continuing to find opportunities in the Fraser Valley, even in the face of lower inventories,” said Narinder Bains, Chair of the Fraser Valley Real Estate Board. “With prices remaining strong, we expect to see inventories increase over the coming months as sellers seek to capitalize on price growth after sitting out for so long.

The Board received 2,478 new listings in April, off by 3.2 per cent compared to March, and down by 31.6 per cent compared to last year. The month ended with a total active inventory of 4,632, a 2.2 per cent increase over March, and 14 per cent less than April 2022.

“Our members are starting to see a rise in multiple offers on properties as the spring market kicks in,” said Board CEO, Baldev Gill. “With the heightened activity, many homeowners are asking: is now the right time to buy or sell? There is no simple – or single – answer to this question, but a wise first step would be to consult with a professional REALTOR® to determine the best path to meet your personal objectives.”

Low inventories helped nudge prices upward with the composite Benchmark price up by 2.8 per cent to $992,000 and single-family detached homes up by nearly four per cent, month-over-month.

Across Fraser Valley in April, the average number of days to sell a single-family detached home was 25 days and a townhome was 23 days. Apartments took, on average, 26 days to sell.


Get in touch with Iwa if you want to know specifically about any areas, property types, or trends that you can take advantage of in 2023.


Read

Home prices across Metro Vancouver’s housing market showed modest increases in March, while new listings remained below long-term historical averages.

March data also indicates home sales are making a stronger than expected spring showing so far, despite elevated borrowing costs.

The Real Estate Board of Greater Vancouver (REBGV) reports that residential home sales in the region totalled 2,535in March 2023, a 42.5 per cent decrease from the 4,405 sales recorded in March 2022, and 28.4 per cent below the 10-year seasonal average (3,540).

The MLS® Home Price Index composite benchmark price for all residential properties in Metro Vancouver is currently $1,143,900. This represents a 9.5 per cent decrease over March 2022 and a 1.8 per cent increase compared to February 2023.

“On the pricing side, the spring market is already on track to outpace our 2023 forecast, which anticipated modest price increases of about one to two per cent across all product types,” Andrew Lis, REBGV’s director of economics and data analytics said. “The surprising part of this recent activity is that these price increases are occurring against a backdrop of elevated borrowing costs, below-average sales, and new listing activity that continues to suggest that sellers are awaiting more favorable market conditions.”

There were 4,317 detached, attached and apartment properties newly listed for sale on the Multiple Listing Service® (MLS®) in Metro Vancouver in March 2023. This represents a 35.5 per cent decrease compared to the 6,690 homes listed in March 2022, and was 22.3 per cent below the 10-year seasonal average (5,553).

The total number of homes currently listed for sale on the MLS® system in Metro Vancouver is 8,617, an 8.1 per cent increase compared to March 2022 (7,970), and 17.3 per cent below the 10- year seasonal average (10,421).

Across all detached, attached and apartment property types, the sales-to-active listings ratio for March 2023 is 30.7 per cent. By property type, the ratio is 23.3 per cent for detached homes, 36.7 per cent for townhomes, and 34.9 per cent for apartments.

Analysis of historical data suggests downward pressure on home prices occurs when the ratio dips below 12 per cent for a sustained period, while home prices often experience upward pressure when it surpasses 20 per cent over several months.

“If home sellers remain on the sidelines, monthly MLS® sales figures will continue to appear lower than historical averages as we move toward summer,” Lis said. “But it’s important to recognize the chicken-and-egg nature of these statistics. The number of sales in any given month is partially determined by the number of homes that come to market that month, along with the inventory of unsold homes listed in previous months. With fewer homes coming on the market,homes sales will remain lower than we’re accustomed to seeing at this point in the year, almost entirely by definition.”

Momentum continues to build in the Fraser Valley real estate market

SURREY, BC – March 2023 saw the second consecutive month of growth in sales in the Fraser Valley, and although still below seasonal norms, the trend is an encouraging sign that the region continues to head towards increased market stability.

At 1,550, property sales posted on the FVREB’s Multiple Listings Service (MLS®) were 72.6 per cent higher than sales recorded last month. Although 39.9 per cent lower than a year ago and nearly 25 per cent below the ten-year average, it marks the first time since August that monthly sales exceeded the 1,000 level.

“After months of uncertainty made it difficult for buyers and sellers to re-enter the housing market, we may well be seeing a turning point,” said Narinder Bains, Chair of the Fraser Valley Real Estate Board. “The pause in rate hikes has helped to restore a much-needed sense of predictability, which is building consumer confidence. As a result, we’re starting to see more traffic at open houses along with more multiple offer situations.”

As in all regions across the province and the country, low supply is still an issue and a primary factor driving price growth.

New listings, at 2,559, were 32 per cent higher than in February, but still 44.1 per cent below last year, while active listings were up by 2.8 per cent over last month and 3.5 per cent below last year. However, both are well off the ten-year average and among the lowest March listings recorded in a decade.

As a result, the aggregate sales-to-active listings ratio grew to 34 per cent, shifting the market into sellers territory, with demand for townhomes even more pronounced, at a 62 per cent ratio. (The market is considered balanced when the sales-to active listings ratio is between 12 per cent and 20 per cent.)

Benchmark prices continued to edge upward with roughly two per cent month-over-month growth across all categories. The composite Benchmark price was $965,100 in March.

“While market demand continues to trend up, we still face an uphill battle on the supply side, which is keeping prices elevated,” said FVREB CEO, Baldev Gill. “The province will require sustained inventory growth of at least 25 per cent over each of the next five years in order to normalize inventories. Until then, we strongly advise buyers and sellers to consult with a REALTOR® to plan the best strategy.”

Properties spent slightly fewer days on the market compared to last month with detached homes posting 30 days on the market and apartments 29. Townhomes moved faster, at 26 days.


Get in touch with Iwa if you want to know specifically about any areas, property types, or trends that you can take advantage of in 2023.


Read

February listing data show a continued reluctance among prospective home sellers to engage in Metro Vancouver’s housing market, leading to below-average sales activity. With sales remaining well-below historical norms, the number of available homes for sale in the region have continued inching upwards. 


The Real Estate Board of Greater Vancouver (REBGV) reports that residential home sales in the region totalled 1,808 in February 2023, a 47.2 per cent decrease from the 3,424 sales recorded in February 2022, and a 76.9 per cent increase from the 1,022 homes sold in January 2023. 


Last month’s sales were 33 per cent below the 10-year February sales average. 


“It’s hard to sell what you don’t have, and with new listing activity remaining among the lowest in recent history, sales are struggling to hit typical levels for this point in the year,” said Andrew Lis, REBGV’s director, economics and data analytics. “On the plus side for prospective buyers, the below-average sales activity is allowing inventory to accumulate, which is keeping market conditions from straying too deeply into sellers’ market territory, particularly in the more affordably priced segments.”

 
There were 3,467 detached, attached and apartment properties newly listed for sale on the Multiple Listing Service® (MLS®) in Metro Vancouver in February 2023. This represents a 36.6 per cent decrease compared to the 5,471 homes listed in February 2022 and a 5.2 per cent increase compared to January 2023 when 3,297 homes were listed. 


The total number of homes currently listed for sale on the MLS® system in Metro Vancouver is 7,868, a 16.7 per cent increase compared to February 2022 (6,742) and a 5.2 per cent increase compared to January 2023 (7,478). 


“While we continue to expect home price trends to show year-over-year declines for a few more months, current data and market activity suggest pricing is firming up. In fact, some leading indicators suggest we may see modest price increases this spring, particularly if sales activity increases and mortgage rates hold steady,” Lis said. “In the somewhat unusual market environment we find ourselves in right now with higher mortgage rates, fewer sales, and inventory that is inching higher but remains far from abundant, working with a Realtor who understands your local market conditions and has experience navigating challenging markets is paramount.” 


For all property types, the sales-to-active listings ratio for February 2023 is 23 per cent. By property type, the ratio is 16.8 per cent for detached homes, 30.1 per cent for townhomes, and 25.8 per cent for apartments. 


Generally, analysts say downward pressure on home prices occurs when the ratio dips below 12 per cent for a sustained period, while home prices often experience upward pressure when it surpasses 20 per cent over several months. 


Signs of stability in Fraser Valley create opportunities for home buyers and sellers.

House prices in the Fraser Valley posted a slight but positive bump in February after nearly a year of month-over- month decreases. Similarly, sales, though still trending lower than normal, also recorded their first monthly gain since October.

The Fraser Valley Real Estate Board (FVREB) processed 898 sales on its Multiple Listing Service® in February, an increase of 43.5 per cent over January but still only half as many as were recorded a year ago.

February new listings were also up, by 5.7 per cent over last month to 1,938 but 48.2 per cent lower than this time last year. Active listings grew by 7.0 per cent over January and by 16.3 per cent over February 2022.

The composite Benchmark price in February was $946,700 and though relatively flat compared to January with a negligible gain of 0.5 per cent, it reverses the price slide the market has been experiencing since April 2022. Further, while well below the record prices posted at that time, it is still more than 36 per cent higher than pre-pandemic February 2020.

“In recent months, the level of uncertainty regarding rates and prices has negatively impacted inventory and that’s kept a lot of clients on the sidelines,” said Sandra Benz, President of the Fraser Valley Real Estate Board. “Together with a growing consensus suggesting that a pause on rate hikes is imminent, the positive signals from the market give families something to build on and plan for. As that starts to happen we expect to see sales pick up slowly but steadily heading into spring.”

With a sales-to-active listings ratio of 20 per cent, the overall market was once again in balance, however the ratio for townhomes was higher at 36 per cent, indicating a seller’s market for this category. The market is considered in balance when the ratio is between 12 per cent and 20 per cent.

“All indications suggest that the market is on track to re-establish a level of stability, which is encouraging for both demand and supply sides,” said Baldev Gill, Chief Executive Officer of the Board. “With solid opportunities for properties that are appropriately priced, investing in the expertise of a professional REALTOR® should be the first decision buyers and sellers make to ensure the best local strategies before jumping back into the market.”

Properties spent between 7 and 12 fewer days on the market compared to last month, another sign that the market may be picking up. Across Fraser Valley in February, the average number of days to sell a single-family detached home was 36 and a townhome was 33 days. Apartments took, on average, 32 days to sell.

Read